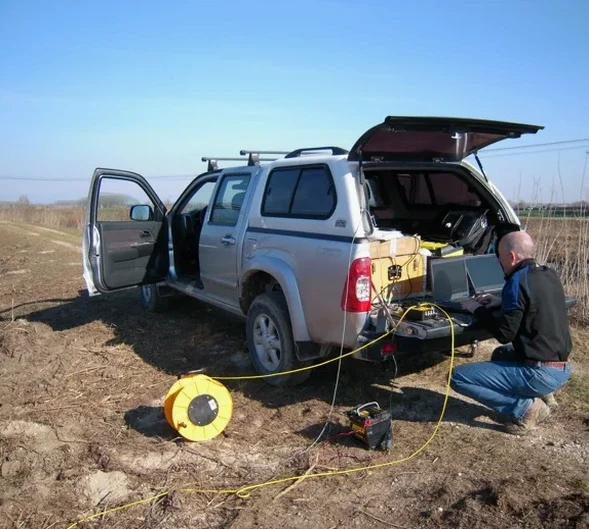
The number one mistake we see on Mississauga sites is assuming the bedrock is flat just because the surface is flat. The city sits on the South Slope of the Peel Plain, where the Georgian Bay Formation limestone dips gently southwest, but the overburden—mostly Halton Till with sand and gravel interbeds—can hide a buried rockhead with 10 to 15 metres of relief across a single block. Relying on sparse boreholes alone misses those steps. Our team runs seismic tomography lines to image compressional wave velocity from grade down to 40 metres. The technique works by measuring first-arrival travel times along a geophone spread, then inverting the data with a ray-tracing algorithm. For deeper targets we switch to seismic reflection, which stacks common-midpoint gathers to resolve strata below 50 metres. The result is a continuous velocity section that ties borehole control to geophysics, giving structural and geotechnical engineers a reliable picture before shoring or excavation begins. When the overburden is thick, combining p-wave refraction with MASW helps separate shear strength contrasts from simple stiffness layering.
Boreholes give you one point. Tomography gives you the line between them—and in Mississauga’s irregular rockhead, that line is where the surprises hide.
Site-specific factors
A 14-storey mixed-use project on Dundas Street East ran into a problem we have documented across the Cooksville area: the upper Halton Till was competent, N60 above 30, but at 18 metres the limestone rockhead dropped 8 metres vertically across a 20-metre lateral distance. The borehole grid, spaced at 30 metres, missed the step entirely. When the excavation hit the low side, the shoring design—based on a uniform rock elevation—was suddenly under-embedded. The general contractor had to scramble for a redesign, losing six weeks. Our seismic tomography line across the same footprint would have picked up that velocity contrast instantly: p-wave velocities jumped from 1800 m/s in the till to 4200 m/s in the limestone, and the step was visible on the tomogram as a sharp lateral gradient. Instead, the project paid for the geophysics after the problem, not before. On sites near the Credit River valley, we also look for low-velocity zones below 1200 m/s that may signal buried channels or karst cavities in the limestone—conditions that affect both bearing capacity and groundwater inflow.
Frequently asked questions
What is the typical cost of a seismic tomography survey in Mississauga?
For most commercial and infrastructure sites in Mississauga, a seismic tomography survey ranges from CA$3,500 to CA$8,190 depending on line length, channel count, and whether only refraction or both refraction and reflection are needed. A single 48-channel refraction line with 2-metre geophone spacing and sledgehammer source runs toward the lower end. Multi-line surveys or reflection profiling with a weight drop source push toward the upper end. Each quote is site-specific and based on the number of lineal metres and the target depth.
How deep can seismic tomography see in Mississauga’s glacial soils?
Refraction tomography typically resolves the upper 25 to 40 metres in Halton Till and sand interbeds, mapping the bedrock surface and any internal velocity breaks. Seismic reflection can reach beyond 80 metres, which is useful for deep infrastructure like tunnel alignments or deep sewer shafts. The actual penetration depends on source energy, geophone spacing, and the velocity contrast between layers. In saturated sands near the Credit River, attenuation can reduce effective depth, so we adjust source type and offset distance accordingly.
Can seismic tomography detect karst cavities in the Georgian Bay Formation limestone?
Yes. Low-velocity zones below 1200 m/s embedded in limestone with background velocities of 4000 to 5000 m/s are strong indicators of dissolution features or mud-filled cavities. The tomographic inversion shows these as localised velocity sags, and we flag them in the interpreted section with a note on their dimensions and depth. For cavity detection we tighten geophone spacing to 2 metres to improve lateral resolution.
How long does a seismic tomography survey take on site?
A single 96-metre refraction line with 48 channels takes about two to three hours of field time, including geophone planting, source impacts, and quality checks on the first breaks. Data processing and tomographic inversion add another one to two days in the office. For multi-line surveys or reflection acquisition with a heavier source, field time scales with the number of shot points and the need for fold coverage, but a typical commercial lot in Mississauga is completed in one field day.